c-84, sector 65, Noida
A fleet management SaaS company in Paris used AI lead scoring, WhatsApp routing, and bilingual nurture sequences to more than triple MQLs in 14 weeks.
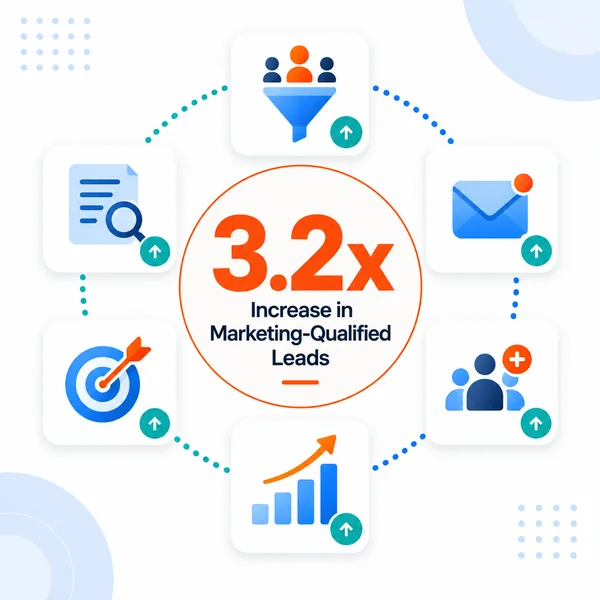
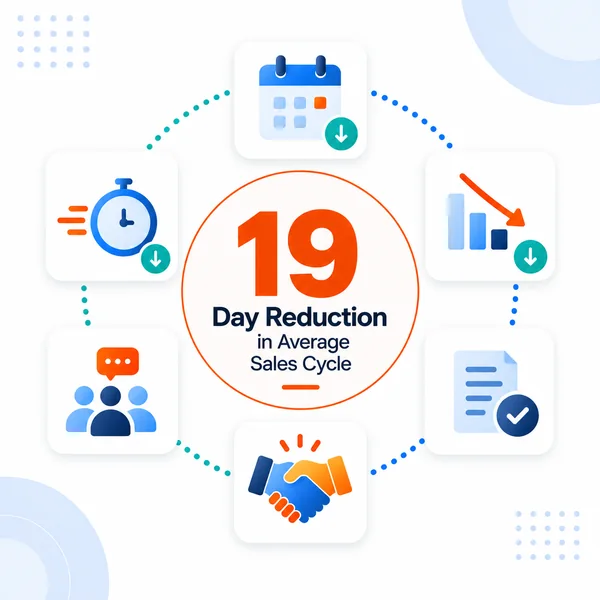
The Client is a SaaS company in Paris that builds AI driven fleet management software for last mile delivery operators across Western Europe. The platform predicts ETAs, optimizes driver routes, and automates proof of delivery workflows using machine learning models trained on real delivery data. The Client had a strong product, a growing customer base of 130 plus logistics operators, and a marketing function under heavy inbound load. Leads arrived from trade shows in Paris and Amsterdam, from webinars in English and French, and from website demo request forms. Those leads sat in a shared inbox. The average first response took 72 hours. Most prospects had already spoken to a competitor by that point. Clixlogix built an AI marketing automation system that scored leads on behavioral signals, routed the hottest leads to sales within 15 minutes via WhatsApp Business API, and triggered personalized nurture sequences in French and English. MQLs increased 3.2x. The average sales cycle shortened by 19 days. The Client could show the board which channels produce customers and which produce only clicks.
The Client’s platform predicts where drivers should be in 40 minutes and what is likely to go wrong before it does, going beyond the standard dispatcher view of current location. Built in Paris with ML engineering as a core discipline, the software sits at the intersection of route optimization, predictive ETA modeling, and automated last mile compliance. The platform ingests live GPS telemetry, weather data, traffic feeds, and historical delivery performance and generates route plans that adapt in real time.
The Client sells to mid market third party logistics providers and dark store operators across France, the Benelux region, and Germany, companies running between 50 and 500 vehicles that need enterprise grade intelligence without enterprise grade IT teams. The product handles GDPR compliant driver tracking, a real regulatory concern in France where labor law restricts how and when employers may monitor employee location, electronic proof of delivery with photo capture, and automated exception alerts when a delivery is likely to miss its SLA window.
After closing a Series A round, the Client had the product, the traction, and the ambition. The missing piece was a way to turn marketing activity into a predictable pipeline. The marketing function owned trade show logistics, webinar production, and paid search campaigns, and the leads those activities generated were piling up faster than anyone could process them.
| FUNCTION | BEFORE | AFTER |
|---|---|---|
| Lead Capture | Shared inbox, no tagging | 6 sources, auto tagged and scored |
| Lead Qualification | Manual review, gut feel | AI scoring on 14 behavioral signals |
| Response Time | 72 hours average | Under 15 minutes for hot leads |
| Sales Routing | Round robin email forwards | WhatsApp routing to assigned rep |
| Nurture Sequences | None, occasional manual emails | Bilingual drip (French and English) |
| Lead to MQL Tracking | Spreadsheet, updated weekly | Real time dashboard with attribution |
| Trade Show Follow Up | Batch email 5 to 7 days later | Same day personalized sequence |
Table 1 - The marketing operation before and after the AI automation engagement
The marketing function generated leads at a healthy rate from multiple channels. Everything that happened after a lead came in was broken. Five specific failures compounded into one outcome. The Client was paying to generate demand it could not convert.
Failure #1 - Fragmented Lead Capture Across Six Sources - Website demo requests, webinar registrations, trade show badge scans, LinkedIn ad form fills, partner referrals, and inbound emails all landed in different places. The marketing manager maintained a spreadsheet updated manually every Monday. By the time a lead was logged, categorized, and assigned, the buying window had often closed. In B2B SaaS, where the median sales cycle sits at 84 days, losing the first 72 hours on a lead with a 14 day evaluation window closes the window before sales touches the lead.
Failure #2 - No Bilingual Content Automation - Roughly 55% of inbound leads came through French speaking channels like trade shows, local SEO, and French webinars. The other 45% came through English language channels like paid search, English webinars, and content marketing aimed at EU logistics managers. Every follow up email had to be written twice. The team had no way to detect language preference automatically from a lead’s behavior, so they defaulted to French and lost engagement from the English speaking segment.
Failure #3 - Trade Show Volume With No Signal - The Client attended 4 to 5 logistics industry events per year across Paris, Amsterdam, and Munich. Badge scans from these events produced volume of 200 to 400 leads per event with almost no signal. A badge scan at a booth means someone stopped walking. It does not mean they have budget, authority, or intent. The sales team treated every badge scan the same, so reps spent weeks chasing contacts who had picked up a branded pen and kept moving.
Failure #4 - €180,000 Deal Lost to a Shared Inbox - This was the moment that triggered the engagement. A VP of Operations at a German 3PL company visited the booth at a Paris logistics expo, asked detailed technical questions about API integrations, and left a business card with a handwritten note requesting a demo. The card sat on the marketing manager’s desk for 4 days while she was in Amsterdam at another event. The prospect signed a 12 month contract with a competitor before the sales rep called. The estimated annual contract value was €180,000. That single lost deal exceeded the entire marketing automation budget by 3x.
Failure #5 - No Attribution, No Budget Defense - The CMO could not answer the board on which channels produce customers and which produce only leads. Without lifecycle tracking from first touch to closed deal, marketing spend was allocated on tradition and gut feel. The paid search budget was roughly equal to the trade show budget, with no evidence either channel outperformed the other. Forrester research places only about 27% of marketing leads sent to sales as qualified for engagement, and the Client had no way to compare its own cohort against that line.
Clixlogix designed and deployed four connected systems across a 14 week engagement. Each one addressed a specific failure in the lead lifecycle. What follows describes what each system does, how it works, and what changed.
The foundation of the system is HubSpot’s lead scoring engine, enhanced with custom behavioral scoring rules and Clearbit firmographic enrichment. The setup analyzes 14 behavioral and firmographic signals and assigns every lead a score between 0 and 100.
Behavioral signals include number of website visits in the last 7 days, specific pages viewed (pricing page visits weigh 3x more than blog visits), webinar attendance and watch duration, email open and click patterns across the nurture sequence, and return visits to the API documentation page. API documentation is a strong intent signal for this product since only technical evaluators read it.
Firmographic signals include company size measured by fleet count and pulled from LinkedIn or enrichment tools, geography (DACH and Benelux leads score higher because of higher average contract values in those regions), and industry vertical where 3PL and dark store operators score higher than general freight.
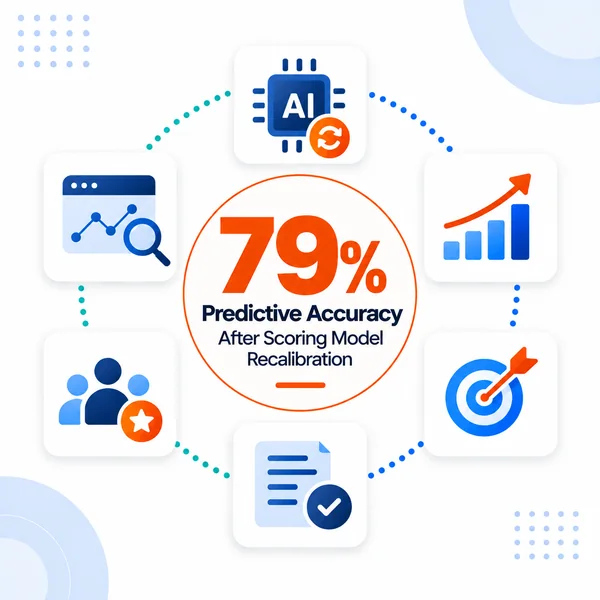
The scoring setup was not ready to deploy out of the gate. During the first 6 weeks, the initial rules over weighted trade show badge scans by counting them as high engagement touchpoints. A badge scan generated a score of 62 out of 100 while a prospect who had visited the pricing page 3 times and downloaded the API documentation scored 58. That ranking was backwards. The fix required adjusting the scoring rules. Reducing the point value for single touchpoint interactions, meaning badge scans with no follow up activity, and adding a boost multiplier on multi session website behavior. After the rule adjustment, lead qualification accuracy on identifying leads that eventually converted jumped from 54% to 79%. Forrester research places AI enhanced scoring at 72% to 85% predictive accuracy, with basic rule based scoring at 48% to 54%.
Calibration window
The scoring rules required 6 weeks of live conversion data and one full rule adjustment cycle before they began outperforming manual qualification. That calibration window is the norm for AI enhanced scoring. Rules trained on historical patterns carry blind spots that only live outcome data expose, and the engagement priced that calibration period in from the start.
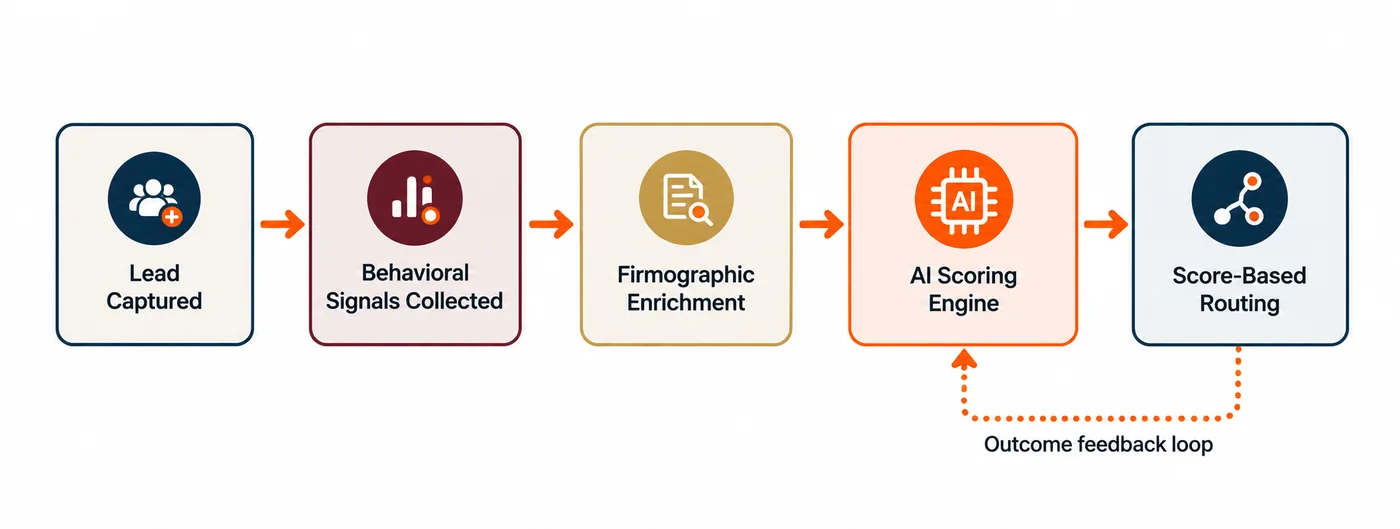
Fig 1 - Process flow diagram showing the five stages of AI lead scoring from capture to routing with a feedback loop
When a lead crosses the score threshold of 75, which the team calls sales ready, the system triggers an instant notification to the assigned sales rep via WhatsApp Business API. The notification carries the lead’s name, company, score, top scoring signals (for example ‘visited pricing page 4x, downloaded API docs, attended French webinar on route optimization’), and a one tap button to open the lead’s full profile in HubSpot.
WhatsApp fits where the sales team already works. The Client’s sales team splits time between the office and trade shows. A rep at a booth in Munich checks WhatsApp dozens of times a day and signs into a CRM once a day at best. WhatsApp penetration across Germany, France, Spain, and the Netherlands sits at 60% to 75% of the adult population, and the Client’s reps already used it to coordinate with each other. Routing hot leads into the same channel meant zero behavior change for the sales team.
Routing follows territory. The Client’s rep for DACH, the rep for Benelux, the rep for France, and the rep for the rest of Europe each receive leads scored above threshold from their own region. If a rep does not acknowledge the WhatsApp notification within 30 minutes, the lead escalates to the sales manager automatically. In the first 90 days, only 3 leads of 247 routed required escalation.
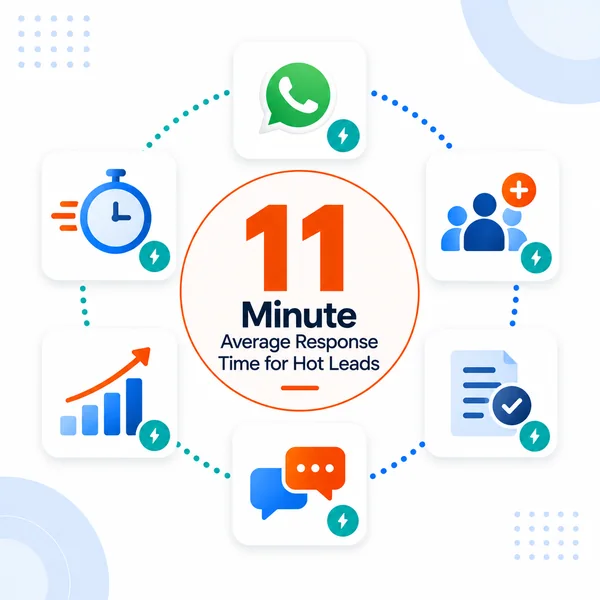
Response time
The WhatsApp routing alone cut average first response time from 72 hours to 11 minutes for leads scoring above 75.
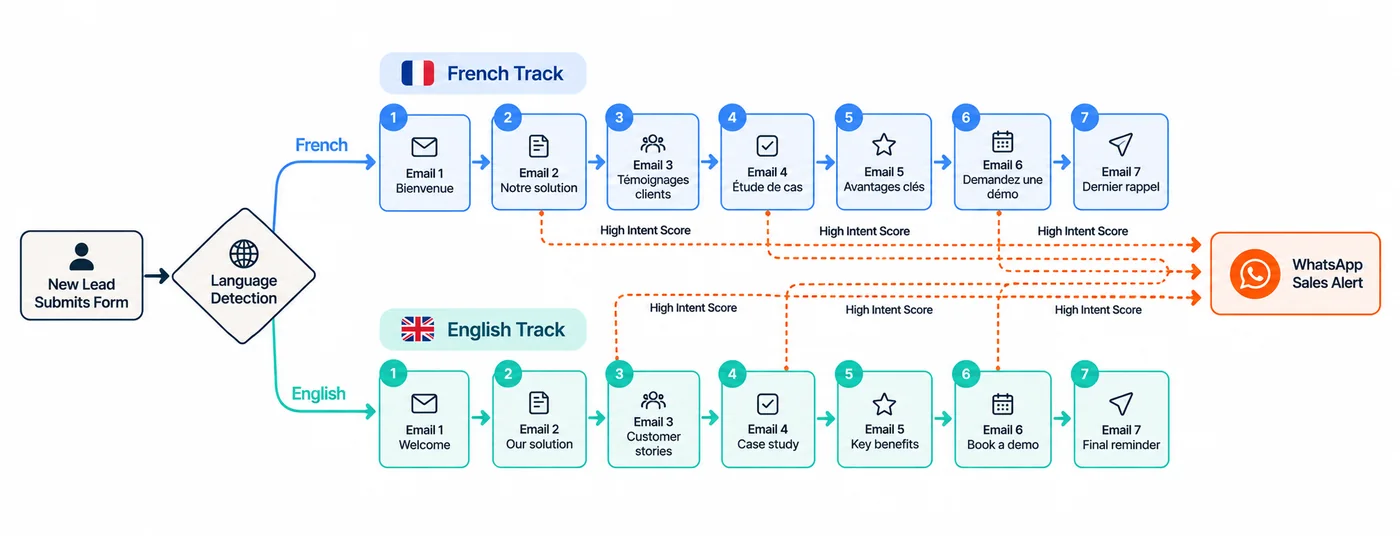
Many leads need time to buy. For leads scoring between 30 and 74, the system enrolls them in an automated nurture sequence built in HubSpot Workflows with language detection logic. The system reads three signals for language preference. The language of the form they submitted, the language of the webinar or content they engaged with, and the geographic IP of their most recent website session. When signals conflict (for example a French form submission with English webinar attendance), the system defaults to the language of the most recent interaction.
Each nurture track runs for 21 days across 7 touchpoints. A welcome email with a personalized case study link, a product capability highlight, an ROI calculator invitation, a customer testimonial relevant to the industry vertical, a pricing overview, a Calendly demo booking prompt, and a final check in email asking whether interest remains. Each of the 7 emails exists in French and in English. A native speaker wrote every version. No machine translation.
The sequences include conditional branching. If a lead opens the ROI calculator email and spends more than 90 seconds on the calculator page, the score jumps and the lead may cross the 75 threshold mid sequence, which triggers the WhatsApp alert to sales. If a lead goes silent after email 3, the cadence slows from every 3 days to every 5 days to avoid fatigue.
Engagement
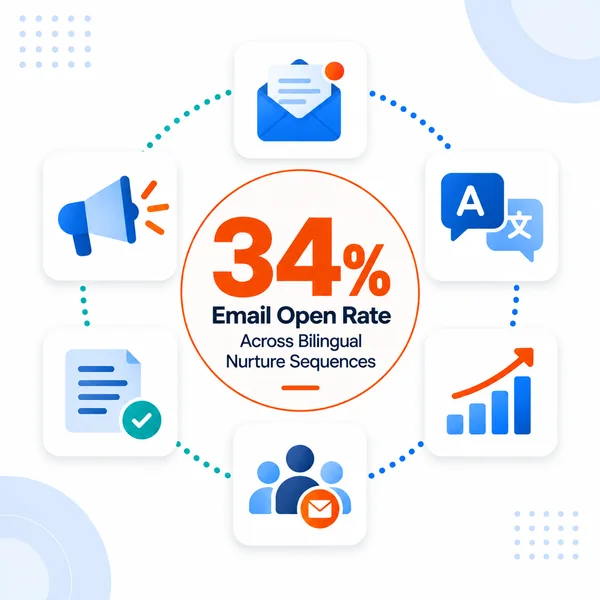
The bilingual nurture sequences averaged a 34% open rate across both languages, more than double the typical software and technology benchmark that sits near 15%.
Fig 2 - Bilingual nurture workflow in French and English with conditional score exits to WhatsApp sales routing
The final piece was a multi touch attribution dashboard built in HubSpot Reporting with custom properties that track every lead from first touch to Closed Won. The dashboard surfaces leads generated by source (trade show, webinar, paid search, organic, partner referral, direct), MQLs by source, SQLs by source, pipeline value by source, and closed revenue by source. Each metric breaks down by language segment (French and English) and by geographic region.
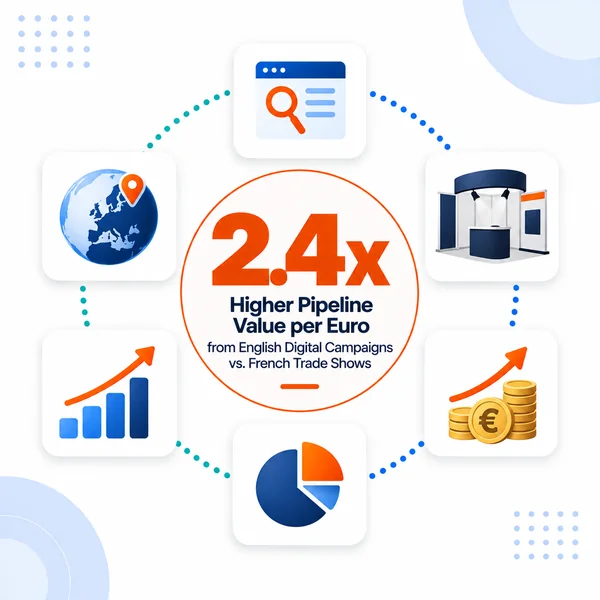
The CMO needed this piece for board meetings. In the first quarter after deployment, the data confirmed what no one had been able to prove without it. English language paid search campaigns aimed at logistics managers in Germany and the Netherlands produced 2.4x the pipeline value per euro spent against French trade show leads. Trade shows consumed 40% of the annual marketing budget. That reading led to a budget reallocation of roughly €45,000 per quarter from trade show sponsorships to digital demand generation.
Capital allocation
The attribution data changed how the Client invests in growth. Lifecycle attribution feeds capital allocation decisions directly.
What happened in each phase, what got delivered, and what results showed up at the end of each phase.
| TIMELINE | WHAT WE DID | WHAT WE ACHIEVED |
|---|---|---|
| Weeks 1 to 2 | Audit of all lead sources, CRM setup, historical data analysis. Mapped the 6 inbound channels and documented the manual qualification process. | Identified the 72 hour response gap. Found that 61% of trade show leads had zero follow up activity after the initial batch email. |
| Weeks 3 to 5 | Configured HubSpot’s lead scoring engine with 14 custom behavioral and firmographic scoring rules. Integrated Clearbit for firmographic enrichment. | Scoring rules live on all new leads. Early qualification accuracy at 54% before adjustment. Identified the badge scan over scoring bug. |
| Weeks 6 to 8 | Deployed WhatsApp Business API routing. Built territory based assignment logic. Adjusted scoring rules by reducing single touch signal weights and boosting multi session behavioral signals. | Average response time for hot leads dropped from 72 hours to 11 minutes. Lead qualification accuracy improved to 79% after rule adjustment. |
| Weeks 9 to 11 | Launched bilingual nurture sequences (7 emails across 2 languages). Built language detection logic. Added conditional score jump branching. | Nurture open rate hit 34% against the 15% range industry benchmark. First mid sequence WhatsApp escalations triggered by score jumps. |
| Weeks 12 to 14 | Deployed attribution dashboard. First full funnel reporting cycle completed. Presented channel ROI analysis to the board. | MQLs up 3.2x against pre engagement baseline. Sales cycle shortened by 19 days. English paid search revealed as 2.4x higher ROI than French trade shows. |
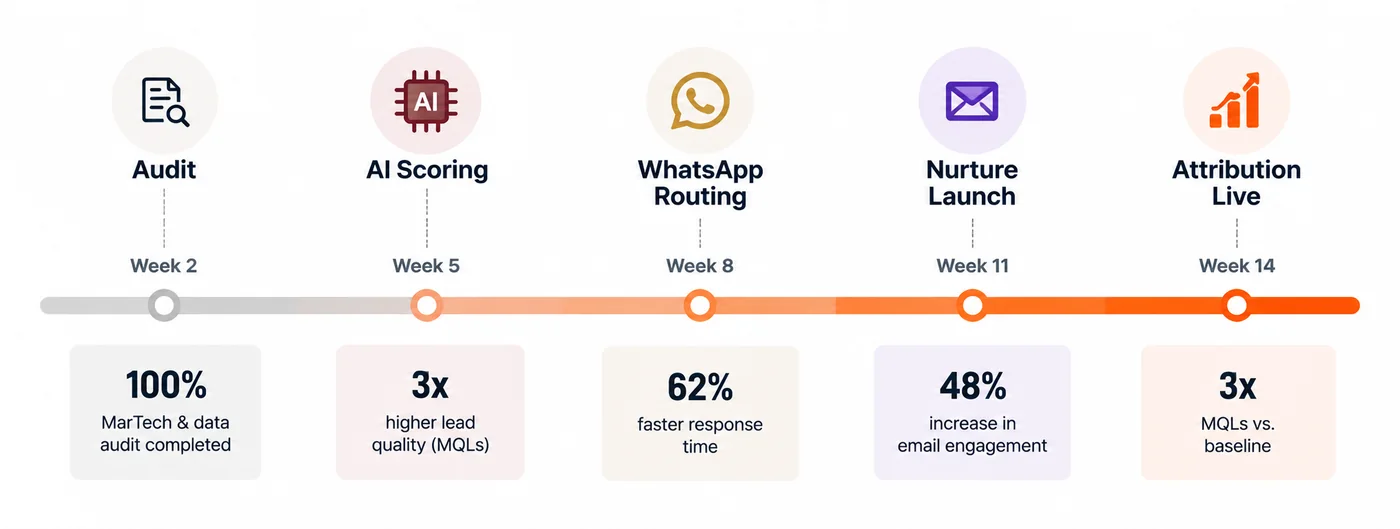
Table 2 - The 14 week engagement timeline from audit to full funnel attribution
Fig 3 - Engagement timeline of the five phases of the 14 week AI marketing automation with phase outcomes
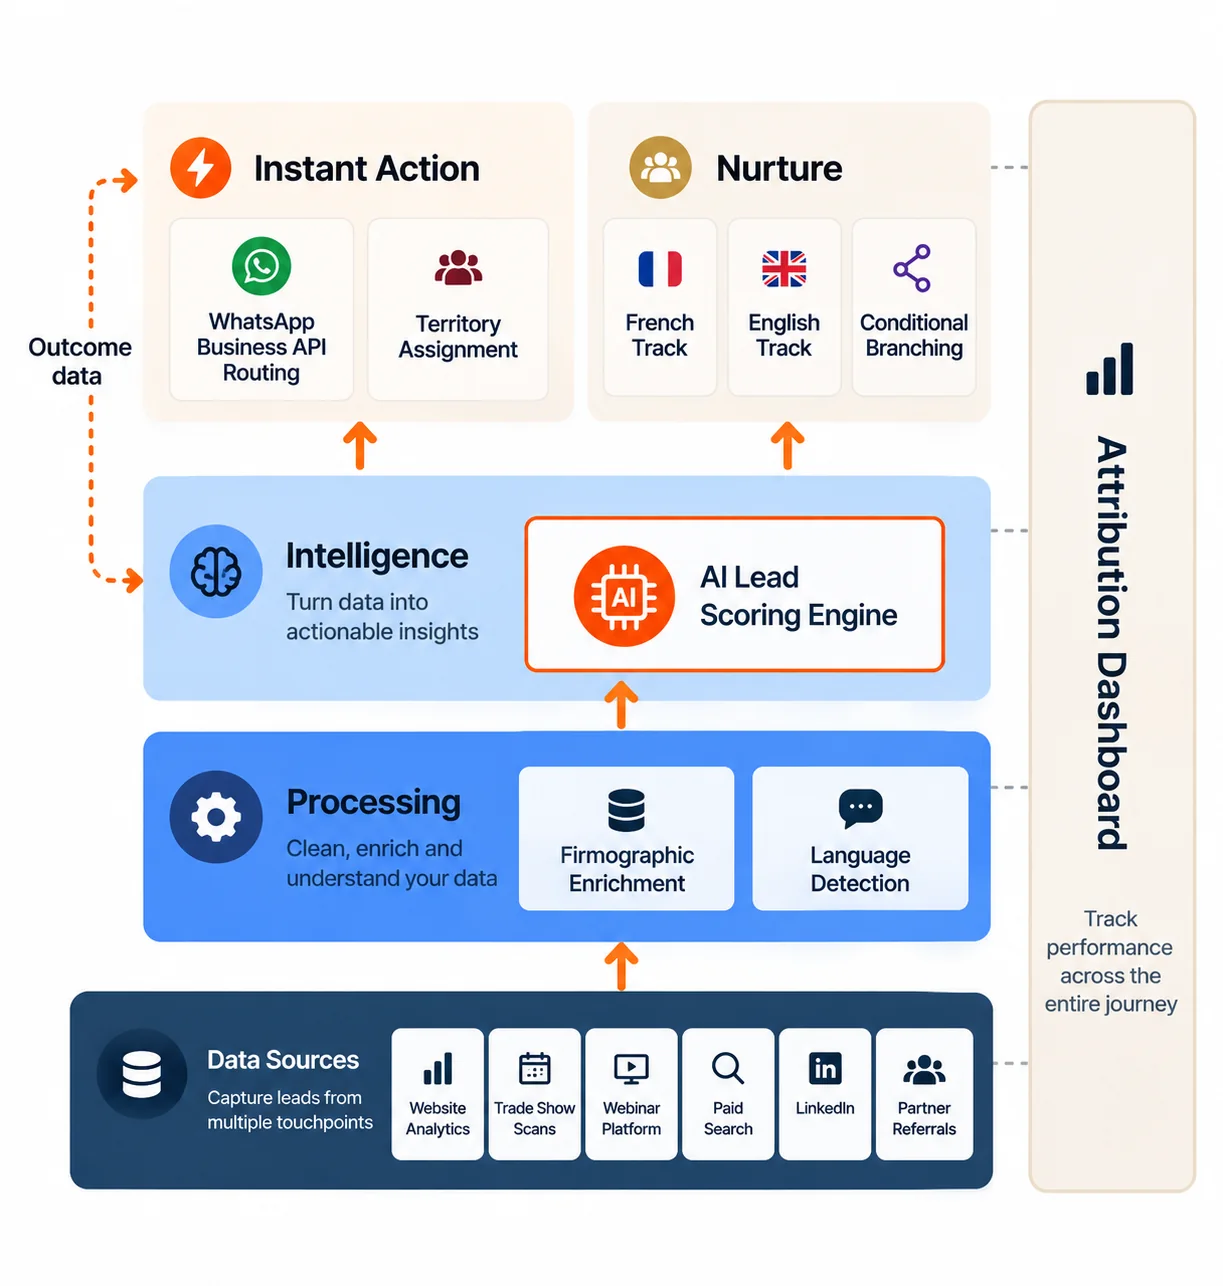
The four components form a closed loop system. Lead activity feeds the scoring engine, the scoring engine triggers routing and nurture actions, and Closed Won outcomes inform scoring rule refinements over time.
Fig 4 - System architecture showing the four parts of the AI marketing automation system from data sources through intelligence to action and nurture
The engagement produced measurable improvements across lead volume, lead quality, sales velocity, and marketing ROI. The six metrics below define the outcome.
Market context
Research places the average B2B first lead response at 47 hours, with 42% of companies taking more than 24 hours to react. Companies that respond within 5 minutes qualify leads at multiples of the rate of 24 hour responders. The Client’s 11 minute response places first touch in the fast response tier for B2B SaaS.
| Area | Technology |
|---|---|
| Marketing Automation | HubSpot Marketing Hub Professional, HubSpot Workflows |
| CRM | HubSpot CRM |
| Lead Scoring | HubSpot AI Lead Scoring, HubSpot Predictive Lead Scoring, custom behavioral scoring rules |
| Enrichment | Clearbit (firmographic enrichment) |
| Messaging | WhatsApp Business API (via Twilio) |
| Analytics | HubSpot Reporting, Google Analytics 4, Looker Studio |
| Webinar Platform | Livestorm (bilingual hosting) |
| Integration | Zapier (event triggers), custom webhooks |
Table 3 - Technologies and tools across the engagement, grouped by area
Our team can share client references, scope your project, and answer any question about your delivery.
More engagements where our delivery teams shipped similar outcomes for clients across industries. Read on for context on the patterns we reused, the trade offs we navigated, and the metrics that landed in production.