c-84, sector 65, Noida
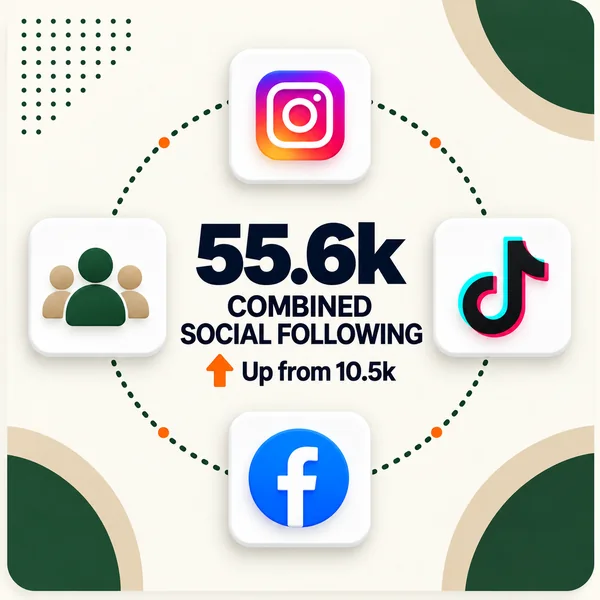
A Denver D2C snack brand grew its social following from 10.5k to 55.6k across Instagram, TikTok, and Facebook, adding 127K in quarterly revenue.
A Denver direct to consumer snack company selling plant based protein bars and trail mixes through its Shopify store and Amazon had strong product reviews and a stalled social media presence. Instagram sat at 8,400 followers with a 0.9% engagement rate. Facebook ran a dormant page with 2,100 followers posting once a week. The brand had no TikTok account at all and still named Gen Z consumers as its core audience. Social driven revenue barely reached 3% of total monthly sales.
Clixlogix built a structured social media marketing program across Instagram, TikTok, and Facebook, centered on short form recipe reels, a 45 creator micro influencer seeding campaign, and a UGC repurposing pipeline tied to shoppable posts.
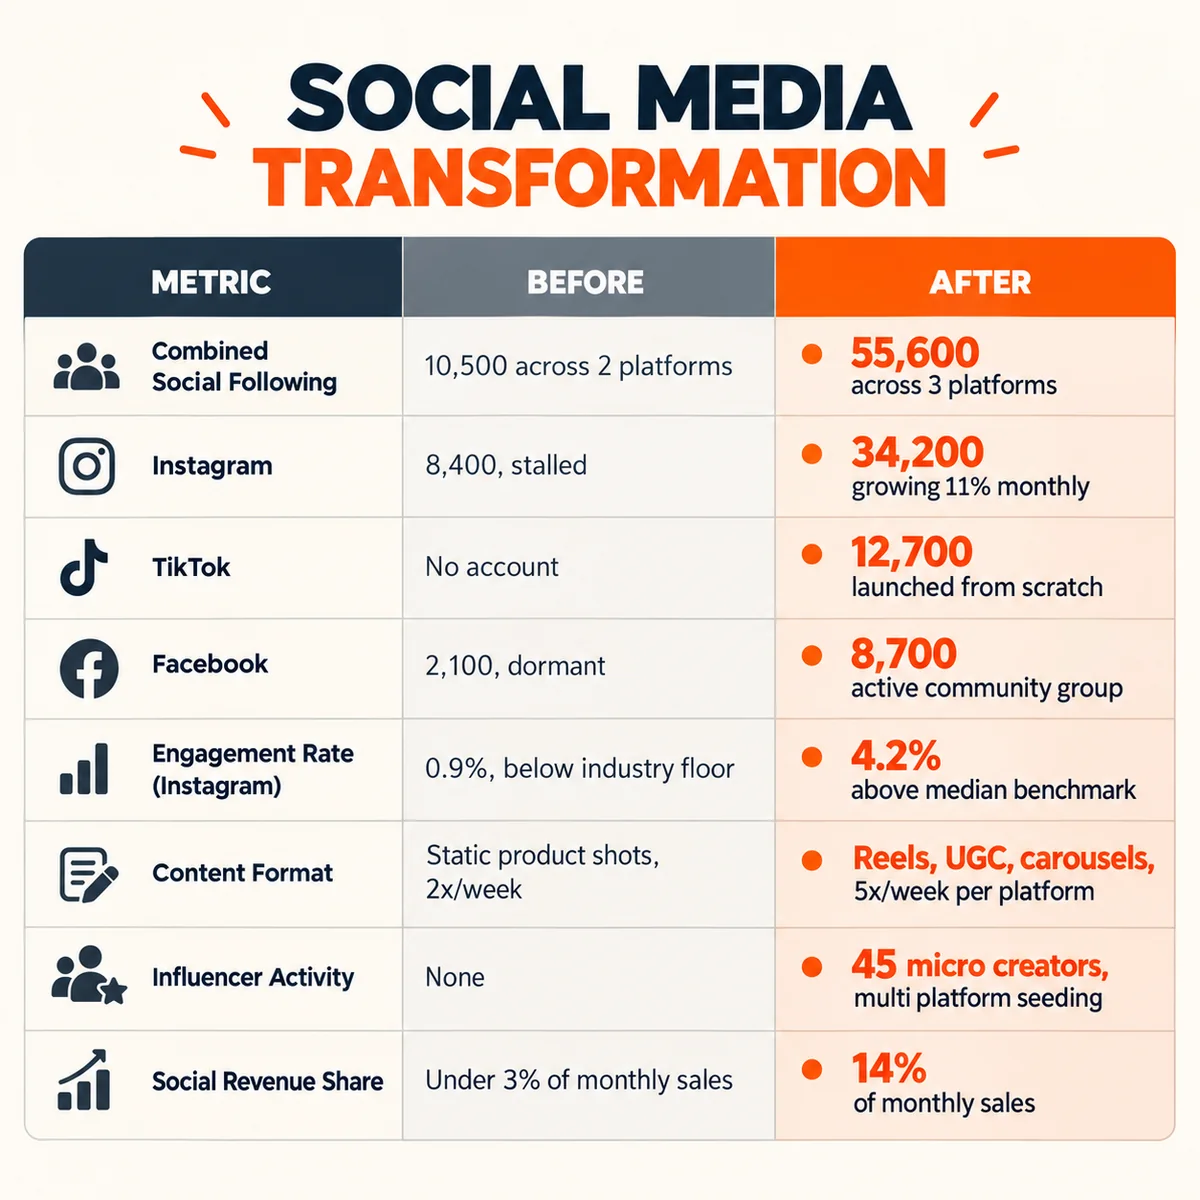
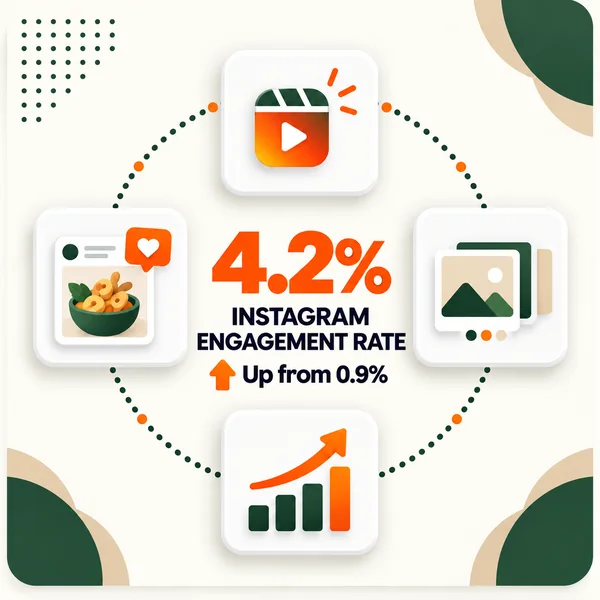
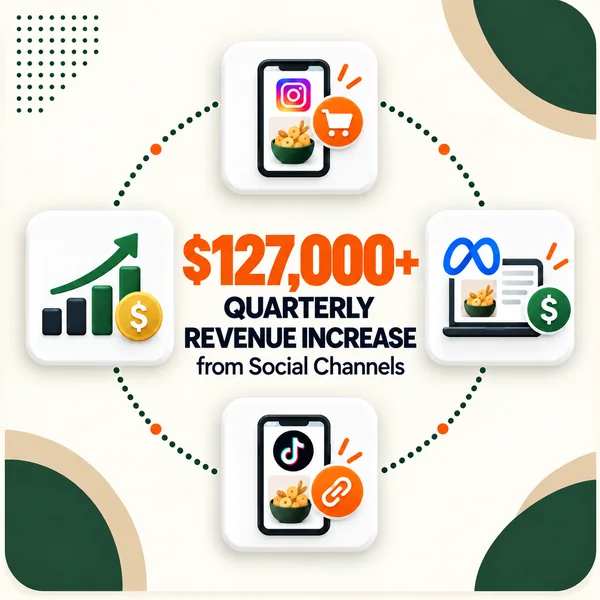
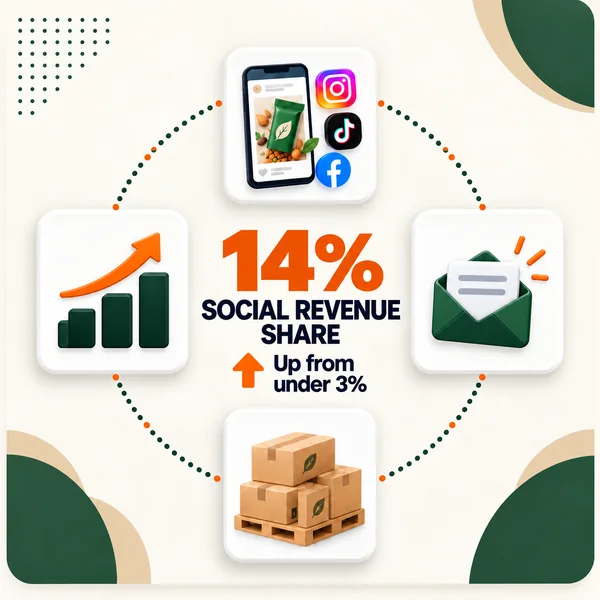
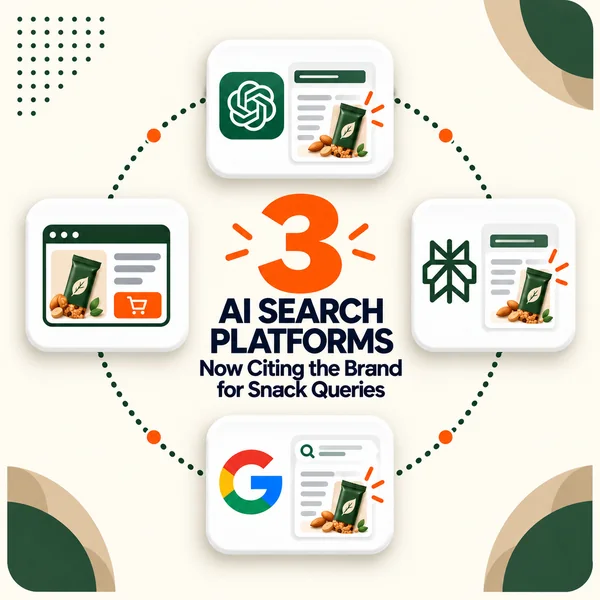
Over six months, combined social following grew from 10,500 to 55,600. Instagram hit 34,200 followers with a 4.2% engagement rate. TikTok, launched from a standing start, reached 12,700 followers. Facebook grew to 8,700 with an active community group. Social attributed revenue reached 14% of monthly sales, a $127,000 quarterly increase, and the brand began appearing in AI search results for plant based snack queries.
| Metric | Before | After |
|---|---|---|
| Instagram followers | 8,400 | 34,200 |
| Instagram engagement rate | 0.9% | 4.2% |
| TikTok followers | 0, no account | 12,700 |
| Facebook followers | 2,100 | 8,700 |
| Combined following | 10,500 | 55,600 |
| Social share of monthly sales | Under 3% | 14% |
Table 1 - Social media metrics before and after the six month engagement
The Client runs a 30 person company based in Denver, Colorado, producing plant based protein bars and trail mixes. Their products use pea protein, hemp seeds, and dried fruits sourced from Colorado and Oregon farms. They sell through a Shopify storefront and Amazon, targeting health conscious millennials and Gen Z consumers in the 22 to 38 age range.
Product quality was never the issue. On Amazon, their top selling protein bar held a 4.6 star rating across 1,800+ reviews. Repeat purchase rate hit 31%, well above the food and beverage industry average of 22% for D2C brands. Wholesale interest came in from regional grocery chains in Colorado and Utah.
The brand’s social media told a different story. Instagram had stalled at 8,400 followers. Posts were studio shots of products on a white background, posted twice a week with generic captions. Engagement rate sat at 0.9%, below the 2.0% to 2.5% range Dash Social’s benchmark report identifies as the target for food and beverage brands on Instagram.
Facebook carried 2,100 followers and a posting rhythm of one product photo per week with zero comments. The brand had no TikTok presence at all, which made it invisible to the Gen Z segment the brand named as its core audience. Social attributed revenue accounted for under 3% of total sales. The brand’s founder described the situation plainly in our first call.
The founder, first call
“We make great bars. Nobody on social media knows we exist.”
Fig 1 - Six Months Of Structured Work - Six months of structured social media work turned three dormant channels into the brand’s fastest growing revenue source.
The Client’s social media problem was five issues stacked together, and fixing any single one in isolation would not have moved the numbers.
Every Instagram post was a product shot on a white background with a caption that read like packaging copy. The feed held no recipes, no people eating the product, and no context for how the bars fit into someone’s day.
Instagram’s algorithm punishes low engagement content by reducing reach. Boring content reaches fewer people, generates lower engagement, and triggers less reach the next time around. The account sat in that loop for over a year. Facebook was worse. One product photo per week, no comments, no shares, no community. The page existed because someone had created it two years ago, and nobody was managing it.
At the time the engagement started, Instagram Reels were generating nearly double the engagement of carousel posts for food and beverage brands. The Client had never posted a single Reel. Two other Colorado based snack brands competing in the same category were posting recipe reels three to four times a week and growing at 8% to 12% monthly follower rates.
The TikTok gap was larger. The brand’s core Gen Z audience in the 22 to 27 age range spends more time on TikTok than any other social platform, and plant based food content consistently trends in the #healthytok and #gymtok communities. The Client had no TikTok account and still targeted Gen Z consumers on the platform Gen Z uses as a primary channel for finding new brands.
No seeding program, no gifting, no affiliate structure. The founder had reached out to three macro influencers in the 500K+ follower range months earlier, received quotes of $3,000 to $8,000 per post, and abandoned the idea.
The founder had missed what was happening further down the follower curve. Micro influencers in the 5K to 50K follower range, particularly in the fitness and outdoor recreation niches, were delivering higher engagement rates and higher conversion rates than macro creators at a fraction of the cost.
Shopify’s social commerce features sat untouched. The Client’s Shopify store carried Instagram Shopping integration available and never activated. The Client had not set up Facebook Shop. No products carried tags on either platform. When someone saw a post and wanted to buy, that person had to leave the app, search for the website, find the product, and check out manually. Every extra step in that chain loses buyers.
When someone asked ChatGPT, Perplexity, or Google AI Overview for “best plant based protein bars in Colorado” or “healthy trail mix brands for hikers,” the Client did not appear. Product pages carried thin descriptions, no structured data, and no UGC or third party mentions feeding the content signals AI engines use to generate answers. Branded web mentions correlate with AI Overview visibility more than three times more strongly than backlinks alone.
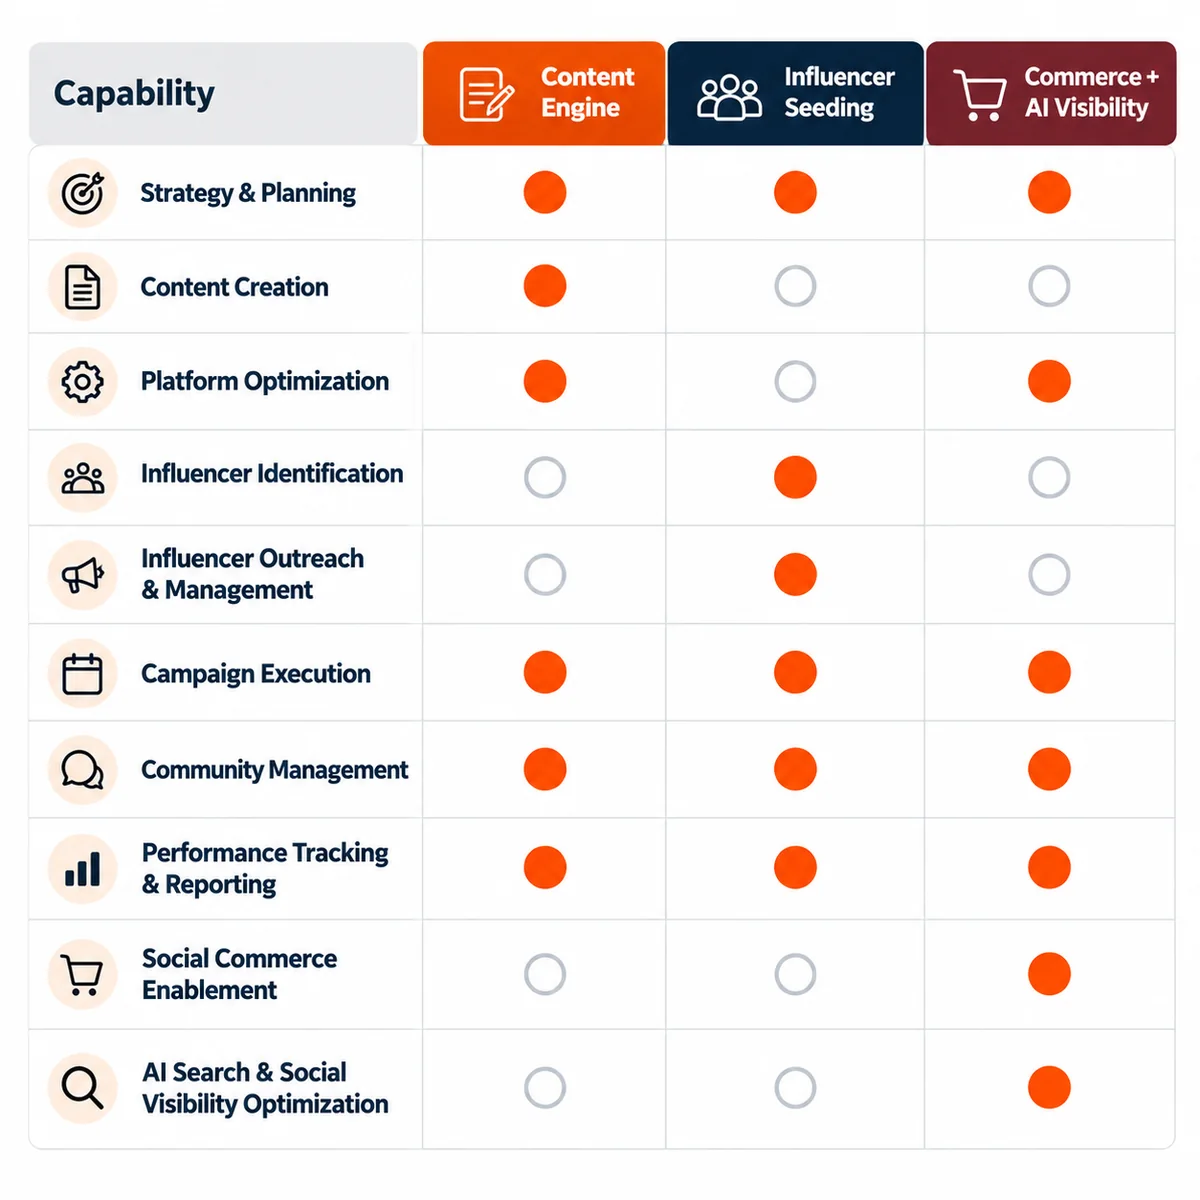
Clixlogix structured the engagement into three parallel work tracks running across six months. All three tracks launched in the first two weeks and operated simultaneously across Instagram, TikTok, and Facebook, because the content calendar, influencer seeding, and commerce integration needed to feed each other from the start.
Fig 2 - Three Parallel Work Tracks - Three work tracks ran simultaneously from week two, each feeding content and data to the others.
Clixlogix retired the white background product shot approach across all three platforms in week one.
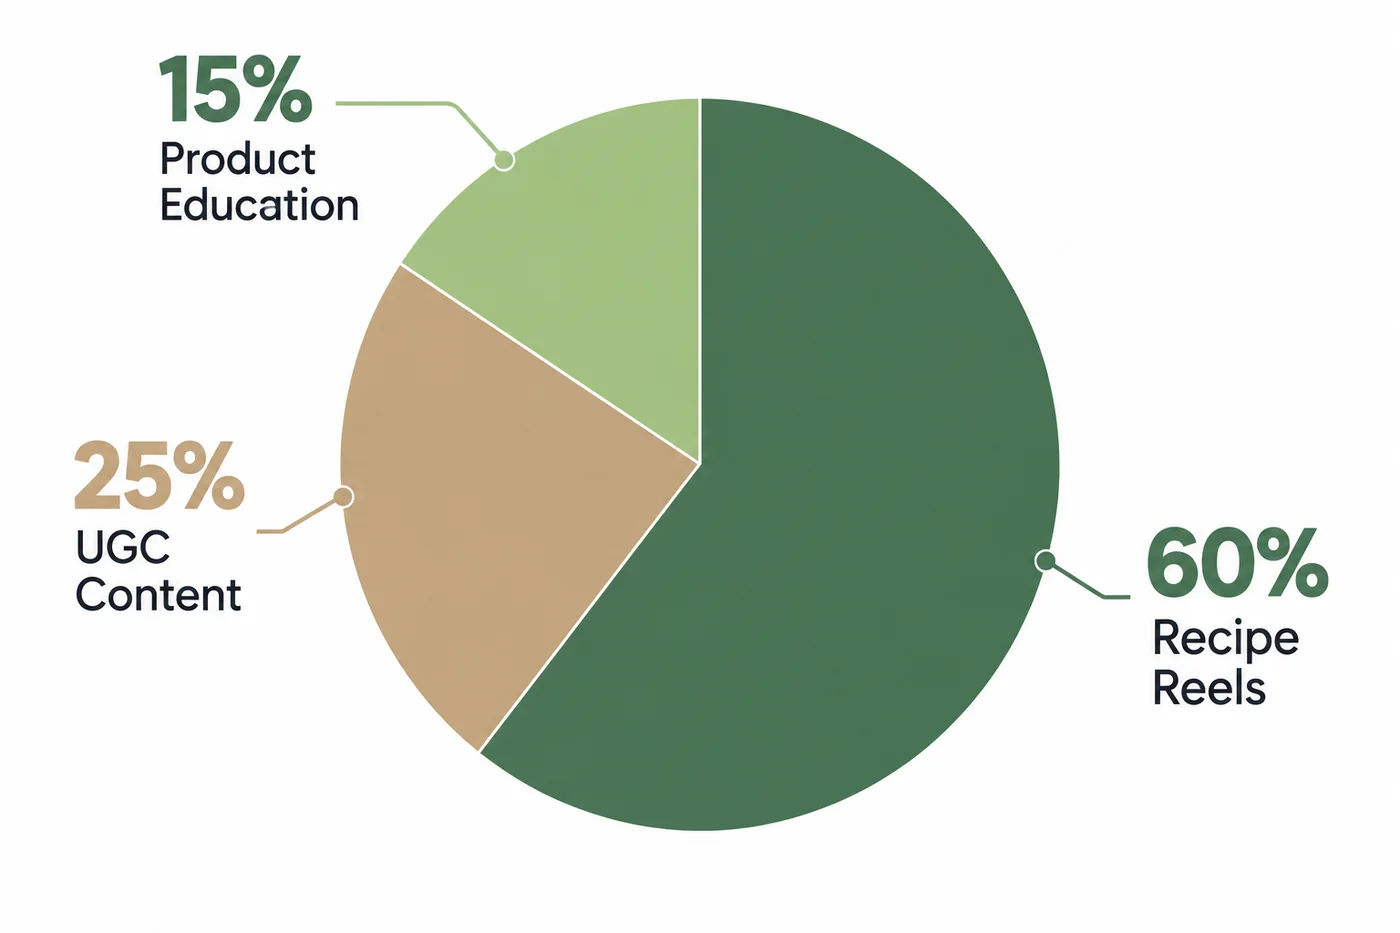
Clixlogix built a content calendar that shifted the ratio to three content types.
Posting frequency climbed from two times a week on Instagram alone to five posts per week across platforms.
| Day | Platforms | Format |
|---|---|---|
| Tuesday, Thursday, Saturday | Instagram and TikTok | Reels, posted simultaneously |
| Monday, Wednesday | Instagram and Facebook | Carousel or static posts |
Table 2 - The weekly posting rhythm after the content calendar shift
Recipe reels became the centerpiece, and TikTok became the testing ground. Clixlogix developed a format called “30-Second Fuel,” short recipe videos showing the product in real food contexts. The first month of content included three.
Each reel ran 18 to 32 seconds, opened with a close up food shot in the first 0.8 seconds as the hook frame, and ended with a product tag and a “Link in bio” call to action. Clixlogix posted these to both Instagram Reels and TikTok simultaneously, with one adjustment. TikTok versions used trending audio tracks and faster cuts, and Instagram versions used licensed music and slightly longer transitions. Each platform received content edited to how its audience consumes video.
The Client filmed raw footage in their Denver kitchen using an iPhone 14 Pro and a $40 ring light. No production crew. No rented studio. Our team cut the raw clips into platform specific edits, added captions, transitions, music, and product tags, with a 24 hour turnaround from raw footage to published reel.
Authenticity carried the content, and the output worked. The first recipe reel, a peanut butter trail mix smoothie, hit 47k views on Instagram in 72 hours. The same clip, recut for TikTok with a trending sound, hit 83k views in the same window. That one post exceeded the reach the account had generated in the previous three months combined.
Carousel posts carried the educational weight on Instagram and Facebook. Clixlogix created a “What’s Actually In Your Bar” series that broke down ingredient sourcing one carousel at a time. One carousel covered pea protein from a Montana farm, another covered hemp seeds from an Oregon cooperative, and another covered dried mango from a fair trade supplier in the Philippines. Each carousel included the supplier’s location, a simple map graphic, and one sentence on why that ingredient earned its place over a cheaper alternative.
This series averaged 3.8% engagement on Instagram, above the 3.4% carousel average. On Facebook, Clixlogix published the same carousels into a branded community group called “Denver Fuel Club,” which grew to 1,400+ members by month four. The group generated discussion, recipe sharing, and repeat purchase intent static page posts never produced.
Fig 3 - 60/25/15 Content Mix - The 60/25/15 content mix replaced a feed that was 100% product catalog shots.
The algorithm friction point - Around week six, engagement on Instagram reels dipped from 4.8% to 2.9% over a 10 day stretch. Clixlogix had been posting three reels per week, all recipe format. Instagram’s algorithm started treating them as repetitive content and suppressed reach to non followers. Our weekly metrics review caught the dip, and we adjusted.
We introduced a second reel format called “Trail Report.” The founder shot 15 second clips of himself eating the product on hikes around Colorado, including Red Rocks, Hanging Lake, and Garden of the Gods, and sent the raw footage to our team. Our editor trimmed and captioned each clip to a consistent format, where every clip opened with “Today’s fuel is [product name], and we are at [location].” Different setting every week, same simple structure.
Engagement recovered to 4.1% within two weeks. TikTok did not show the same dip. Its algorithm rewards consistent recipe format because TikTok users find content through the For You Page, and repetition in format matters less on TikTok than on Instagram.
Clixlogix did not approach influencer marketing the way the Client had tried before. No big names. No $5,000 per post deals. We built a seeding program targeting micro influencers with 5,000 to 45,000 followers in two specific niches. The first niche was fitness, covering CrossFit, trail running, and yoga. The second was outdoor recreation, covering hiking, camping, and climbing. All creators were active in the Mountain West region on Instagram, TikTok, or both.
Sourcing the creators - Our team manually vetted creators against three criteria.
We used Instagram’s native search, TikTok Creator Marketplace browsing, hashtag searches on #coloradohiker, #trailrunnerlife, and #plantbasedathlete, and a free tier of a creator sourcing platform to build the initial list of 120 candidates. Of those 120, the platform split ran as follows.
The outreach pitch was simple - Our team sent a direct message on behalf of the brand offering a free product box containing six bars and two trail mix bags with a retail value of approximately $45. No posting obligation. The message read, “We’re a Denver snack company. We think you’d actually like our stuff. No strings attached, but if you do post, tag us.”
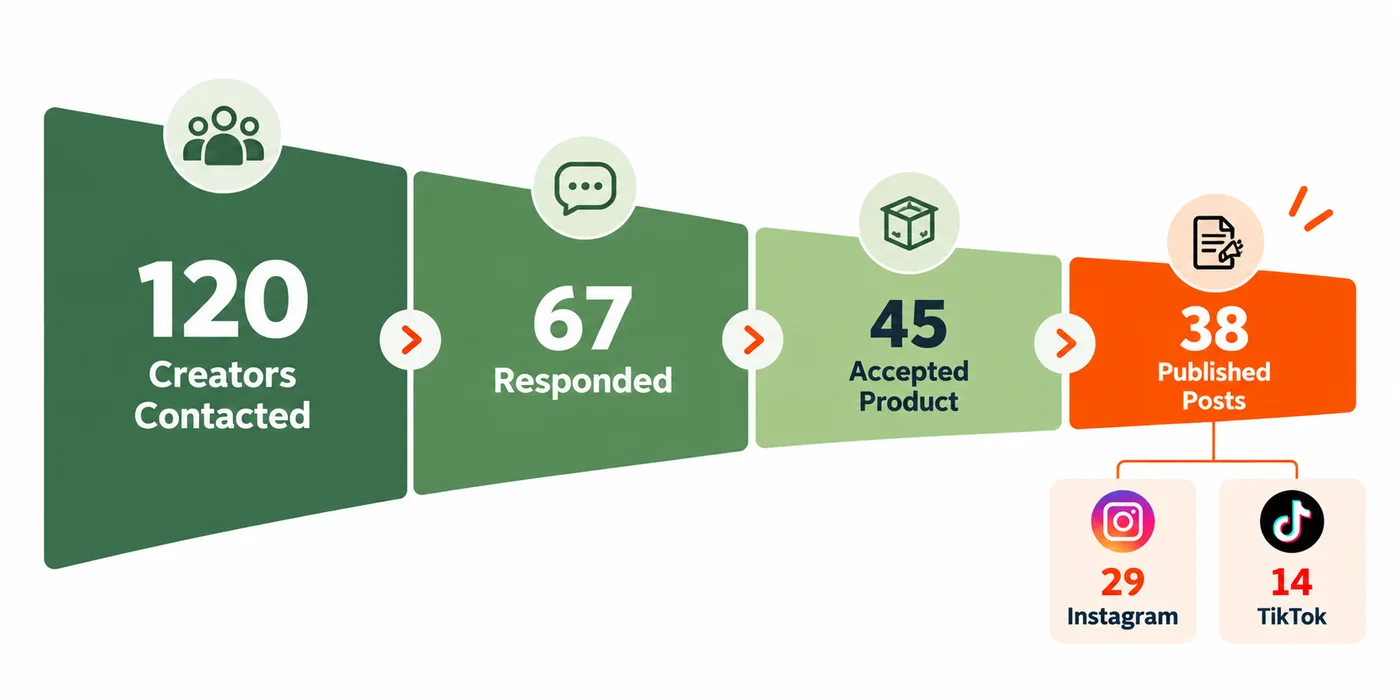
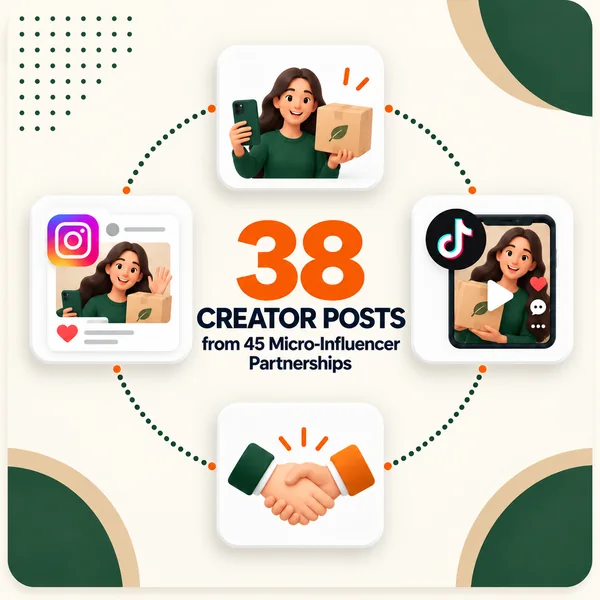
Of 120 outreach messages, 67 creators responded and 45 accepted the product. The Client’s Denver warehouse handled fulfillment, shipping boxes directly to each creator. 38 of the 45 posted at least once within 30 days of receiving the box, with 29 posts going up on Instagram and 14 on TikTok, and five creators posted on both platforms.
| Stage | Creators | Rate |
|---|---|---|
| Outreach messages sent | 120 | - |
| Responded | 67 | 55.8% of messages |
| Accepted the product box | 45 | 37.5% of messages |
| Published within 30 days | 38 | 31.7% of messages, 84.4% of acceptances |
Table 3 - The micro influencer seeding funnel from cold outreach to published posts
The conversion rate on that outreach, 38 creators from 120 messages at 31.7%, runs high for a cold seeding program. Creators shot and posted their own content, in their own style, using the product however they naturally would. We did not provide scripts or shot lists.
Two factors helped the activation rate.
UGC repurposing pipeline - We logged every post a creator shared on Instagram or TikTok in a shared Google Sheet. Our team reviewed each post, requested usage rights through a templated DM, and repurposed the ones with approval (about 62% of posts) in three ways.
TikTok creator content that performed well organically moved into TikTok’s Spark Ads feature, which promotes the creator’s own post as the ad unit.
The UGC performed. Creator content reposted on the brand’s Instagram feed averaged 5.1% engagement, compared to 3.8% for brand produced content. On TikTok, Spark Ads using creator content delivered a 2.3% click through rate, nearly double the platform’s food category average.
Fig 4 - Seeding Funnel - The seeding funnel converted 31.7% of cold outreach into published creator content across Instagram and TikTok.
Activating social shopping across platforms - Our team coordinated with the Client’s Shopify admin to connect the product catalog to Instagram Shopping and Facebook Shop. We tagged all 14 SKUs on both platforms. Every new post, whether brand produced or UGC repost, carried product tags.
We set up a weekly “Friday Drop” rhythm where one shoppable post went live on Instagram and Facebook simultaneously, featuring a product bundle such as “The Hiker’s Pack” with two bars and one trail mix at a slight discount. These Friday posts drove the highest direct purchase click throughs of the week. TikTok Shop was not available for the Client’s account during the engagement period, so we routed TikTok traffic to the Shopify store through the bio link.
Paid amplification stayed minimal and targeted. We ran a $1,800 per month paid budget across Meta and TikTok, split three ways.
The Meta retargeting creative used only UGC images, which generated a 34% higher checkout conversion rate compared to brand produced imagery. The Meta retargeting ROAS averaged 4.7x across the six months. TikTok Spark Ads averaged 3.1x ROAS, lower than Meta retargeting, and reached a younger audience segment the brand had never accessed before.
AI generated video for paid creative - Ad fatigue sets in fast on paid social for food brands. The same UGC clips stop performing after two to three weeks. Clixlogix needed fresh visual material without asking the Client to film constantly, so we used AI video production to generate lifestyle B roll footage covering mountain trail scenes, morning routines, gym bag close ups, and campfire settings.
These were ambient backgrounds. The actual food always came from real footage the Client or creators had filmed, because generating fake food imagery in a D2C context creates trust and compliance risks we were not willing to take. AI video gave us the wrapper, meaning a 5 second opening of a sunrise hike that cut to real footage of someone unwrapping a bar, or a gym time lapse that transitioned into a creator’s post workout smoothie reel.
We produced 11 AI generated B roll clips across the six months and rotated them into retargeting ads on Meta to keep the creative fresh. Ad fatigue, measured by rising frequency and falling CTR, dropped noticeably in the weeks we swapped in new AI generated backgrounds compared to weeks where we reused the same clips.
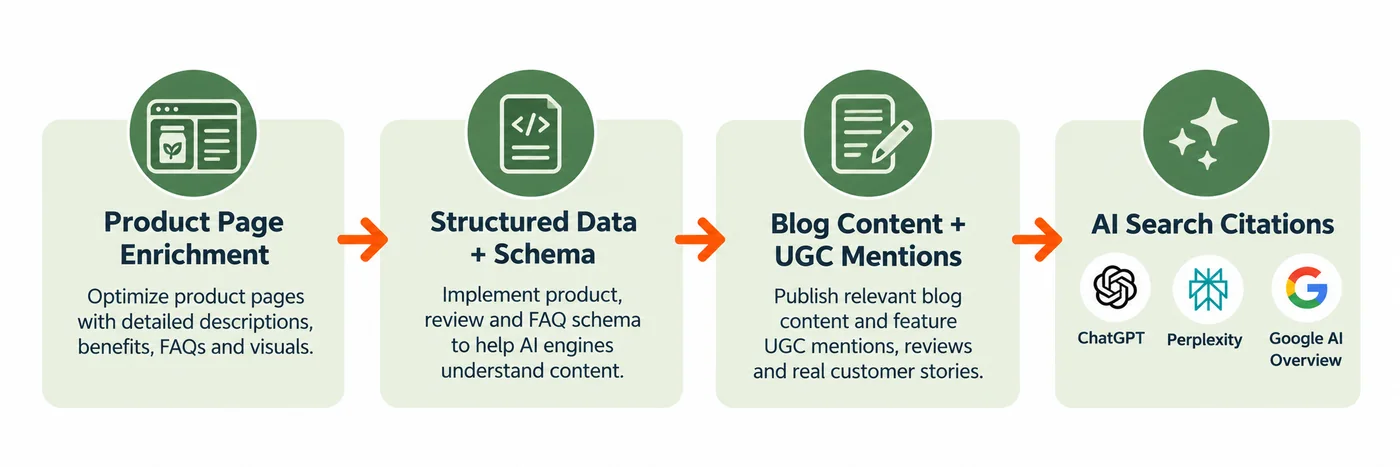
Product page enrichment for AI search signals - Here Clixlogix did something the Client had not asked for and that we knew would matter. Our team rewrote all 14 product descriptions on Shopify. The old descriptions ran two to three sentences of marketing copy. The new ones ran 250 to 400 words each, structured around four elements.
We added structured data covering Product schema with reviews, nutrition, and availability to every product page. We also published four long form blog posts on the Client’s Shopify blog.
Each post cited peer reviewed nutrition studies and linked to the Client’s products contextually, as genuine answers backed by the article’s content.
The goal was to build the content presence AI search engines cite. Brands that appear in Google AI Overviews earn more organic and paid clicks than competitors absent from those summaries. Clixlogix was building content structured for AI generated answers, an approach known as Generative Engine Optimization.
Fig 5 - AI Search Visibility Flow - Product page enrichment and structured blog content created the citation signals AI search engines use to cite and surface brands.
The Instagram algorithm shift in month four - Midway through the engagement, Instagram rolled out a change that reduced reach for accounts leaning heavily on hashtags for new audience exposure. Our early content strategy used 25 to 30 hashtags per post. After the algorithm update, posts carrying more than 10 hashtags saw a measurable reach decline on the account.
We cut hashtag count to 5 to 8 per post, focused on niche tags such as #plantbasedsnacks and #coloradotrailrunning over broad ones such as #healthyfood and #fitness, and shifted new audience effort toward Instagram’s collaborative posts feature, where the brand published jointly with creators.
The adjustment took about 10 days to show up in the metrics, and by month five, organic reach per post had recovered and exceeded pre update levels. This kind of platform specific adaptation is why Clixlogix ran each channel with its own content logic and did not cross post the same content everywhere.
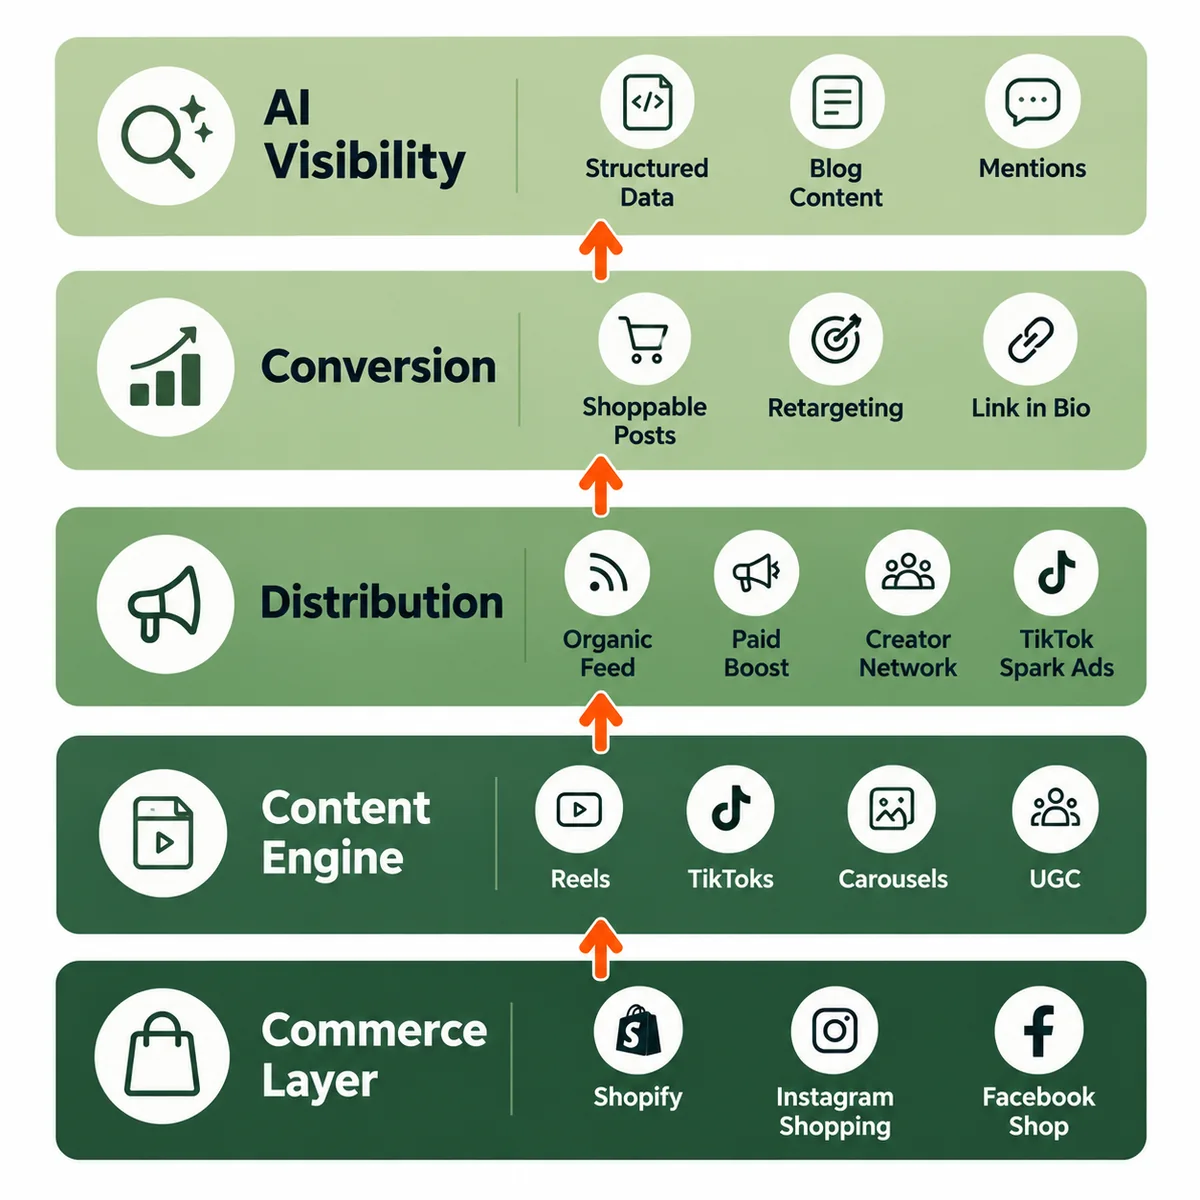
Fig 6 - Three Work Tracks Closed Loop - The three work tracks formed a closed loop across Instagram, TikTok, and Facebook, where content fed the algorithm, influencers produced UGC, and commerce converted attention into revenue.
Six months of structured social media marketing across Instagram, TikTok, and Facebook turned social from a dormant channel into the brand’s fastest growing revenue source. Here is what moved.
Market context
US social commerce is projected to surpass $100 billion this cycle, growing at 18% year over year. Social commerce orders now account for 18.3% of total D2C sales, up from a prior baseline of 5.4% in the preceding reference period, a 240% increase.
| Category | Tools and Platforms |
|---|---|
| Social Media Management | Meta Business Suite, TikTok Business Center, Later (scheduling) |
| E-commerce Platform | Shopify (product catalog, Instagram Shopping, Facebook Shop, analytics) |
| Content Production | Canva Pro (carousel design), CapCut (reel and TikTok editing), AI video generation (lifestyle B roll for ad creative) |
| Influencer Management | Google Sheets (creator tracking), Instagram DM and TikTok DM (outreach), TikTok Creator Marketplace (browsing), manual vetting |
| Paid Advertising | Meta Ads Manager (retargeting, reel boosting on Instagram and Facebook), TikTok Ads Manager (Spark Ads) |
| Analytics and Reporting | Shopify Analytics (social attribution), Instagram Insights, TikTok Analytics, Google Analytics 4 (UTM tracking) |
| SEO and AI Visibility | Shopify Blog (content publishing), Schema markup (Product, FAQ), Generative Engine Optimization content framework |
Table 4 - Technologies and tools used across the engagement
Our team can share client references, scope your project, and answer any question about your delivery.
More engagements where our delivery teams shipped similar outcomes for clients across industries. Read on for context on the patterns we reused, the trade offs we navigated, and the metrics that landed in production.